Pepperstone ECN Forex Broker
Showing posts with label Forex Strategies. Show all posts

SUPPORT RESISTANCE & CANDLESTICK PATTERN


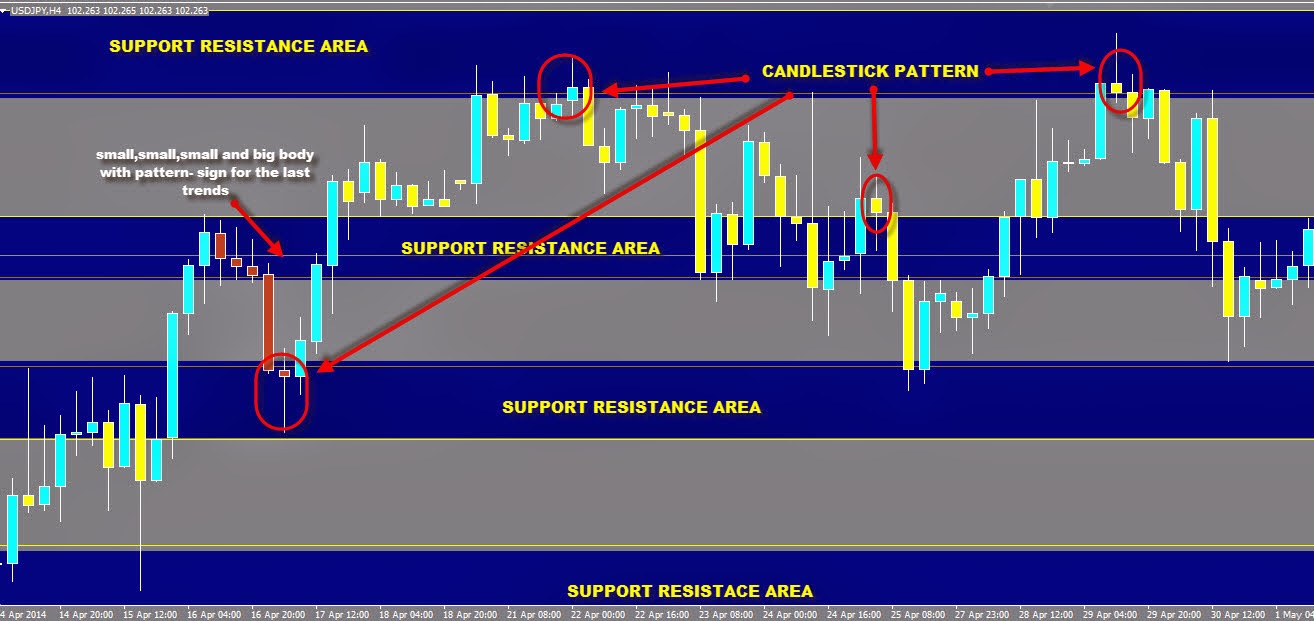
In this article I will show you where to look for the candlestick patterns which have higher probability to signal a good trade. It is very important to know that such a pattern gives a stronger signal if it is formed on a higher time frame and if it appears after a clear up/down move. Other important factors that raise the probability are the technical elements like support/resistance, Fibonacci, Oscillators, Moving Averages and other type of instruments. I will tell you more now how to trade candlestick patterns at key level support and resistances.

candlestick-pattern-support-and-resistance
Support and Resistance Zones

Support – it is a relevant price level for the future price action, because it has triggered a reaction in the past. It is expected to act as a floor next time the price will hit it. The support level is more important if it has resisted in time, if it is found on a higher time frame and if it was touched more than 2 times.
Resistance – it is a relevant price level for the future price action, because it has triggered a reaction in the past. It is expected to act as a ceiling next time the price will hit it. The resistance level is more important if it has resisted in time, if it is found on higher time frame and if it was touched more than 2 times.
As you can see the definitions are pretty the same. It only differs from where the price will hit the level. If the price falls it is expected to be stopped by a support, if it rises it is expected to be stopped by a resistance. Usually a broken support becomes resistance, while a broken resistance becomes support. Ex tops or bottoms can become support/resistance and also very important are round numbers because they have a heavier psychology implication.
support-resistance-candlestick-pattern
Candlestick Pattern in S&R
Bonus - 500:1 Leverage
Get 500:1 Leverage with this link
As you can see the definitions are pretty the same. It only differs from where the price will hit the level. If the price falls it is expected to be stopped by a support, if it rises it is expected to be stopped by a resistance. Usually a broken support becomes resistance, while a broken resistance becomes support. Ex tops or bottoms can become support/resistance and also very important are round numbers because they have a heavier psychology implication.

To understand why this support/resistance work we should bear in mind that at those level the collective memory works. If at some point the price was rejected from a certain level, investors will know and will react again when the price will touch it. For better understanding I will make this short comparison. If someone will touch something, without knowing the fact that it is very hot, it will burn himself. Because of it provokes pain, next time will be more attentive before touching it. This is how support/resistance work in most of the cases.


CANDLESTICK TRICK


TRICK CADLESTICK
CADLESTICK TRICK
CADLESTICK TRICK

Nak Belajar TEKNIK SWING - FOREX???

MY SWING STRATEGIES


WHY I SOLD XAGUSD
FOREX STRATEGIES
FOREX STRATEGIES


Why i Sold EURAUD (H4)
FOREX STRATEGIES


Why i Sold USDJPY (H4)


WHY I BUY AUDUSD


WHY I SELL EURAUD
euraud


How to join us?
Register , Open Account and Deposit with minimum capital to Pepperstone via click

And Screenshot your account number with balance, Sent to us Click Here

And after all process, We will invite to Learn our strategies with signal on Our Facebook Group
FX IB Pepperstone.my

CANDLESTICK STRATEGIES - Candlestick Star pattern


Strategy 1:
Given a great number of different candlestick formations, it would be nearly impossible to gauge the overall profitability of all candlestick strategies in a single study. Instead, we will focus on specific reversal signals that we believe have intuitive value as it relates to market sentiment. In this particular case we will look at both the Morning Star and Evening Star formations as buy-and-sell signals.
CANDLESTICK-STRATEGIES

A Morning Star formation is a bullish reversal signal for an overall downtrend. Given fairly consistent losses, we see a strongly negative full-bodied first candle. The second candle opens at or below the previous close, trading within a relatively narrow range with the high staying below the midpoint of the first candle. The third candle is strongly positive and closes above the midpoint of the first candle. This tells us that bearish sentiment is unable to push price below previous lows, and risks remain for a reversal in price trends.
morning star

The Evening Star is effectively the opposite of a Morning Star, as price starts in an uptrend and the first candle is strongly positive. The second candle opens above or at the previous close, trading within a fairly narrow range and with its low above the previous bar’s midpoint. The third candle is strongly negative and closes below the first candle’s midpoint. This gives warning that bulls are unable to push price to new heights, and a strongly bearish candle hints at further downside potential through subsequent trade.

Sample chat:
Pin Bar Strategies

morning star

morning star


Nak Belajar TEKNIK SWING - FOREX???

WHAT IS FIBONACCI?


FIBONACCI


Leonardo Fibonacci discovered the sequence which converges on phi

Leonardo Fibonacci, discoverer of the Fibonacci series which is related to phi, the Golden ProportionIn the 12th century, Leonardo Fibonacci wrote in Liber Abaci of a simple numerical sequence that is the foundation for an incredible mathematical relationship behind phi.  This sequence was known as early as the 6th century AD by Indian mathematicians, but it was Fibonacci who introduced it to the west after his travels throughout the Mediterranean world and North Africa.
FIBONACCI

Starting with 0 and 1, each new number in the sequence is simply the sum of the two before it.

0, 1, 1, 2, 3, 5, 8, 13, 21, 34, 55, 89, 144, . . .

The ratio of each successive pair of numbers in the sequence approximates phi (1.618. . .) , as 5 divided by 3 is 1.666…, and 8 divided by 5 is 1.60.

The table below shows how the ratios of the successive numbers in the Fibonacci sequence quickly converge on Phi.  After the 40th number in the sequence, the ratio is accurate to 15 decimal places.

1.618033988749895 . . .

FIBONACCI

Compute any number in the Fibonacci Sequence easily!

Here are two ways you can use phi to compute the nth number in the Fibonacci sequence (fn).

If you consider 0 in the Fibonacci sequence to correspond to n = 0, use this formula:

fn =  Phi n / 5½

Perhaps a better way is to consider 0 in the Fibonacci sequence to correspond to the 1st Fibonacci number where n = 1 for 0.  Then you can use this formula, discovered and contributed by Jordan Malachi Dant in April 2005:

fn =  Phi n / (Phi + 2)

Both approaches represent limits which always round to the correct Fibonacci number and approach the actual Fibonacci number as n increases